Navigation: v1.3 Build 9825 |
Release Notes |
Install |
Upgrade |
Administration |
Reference |
API |
Glossary |
Archive
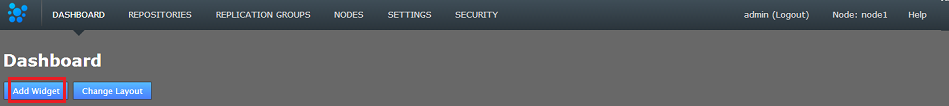
The Dashboard is a configurable repository monitor, providing an administrator with a way to track changes on selected repositories. The tab contains a number of widget panels, some of which can be configured to show information about repositories that are managed by SVN MultiSite Plus.
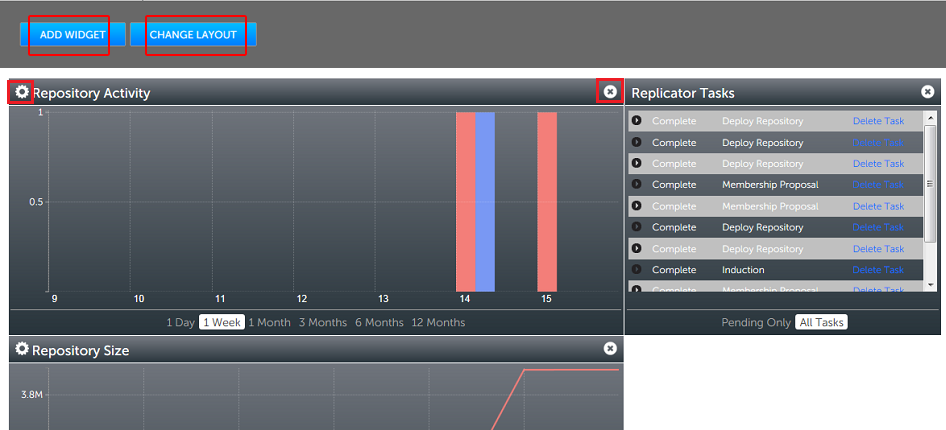
Dashboard provides a means of monitoring repository activity.
Add Widget
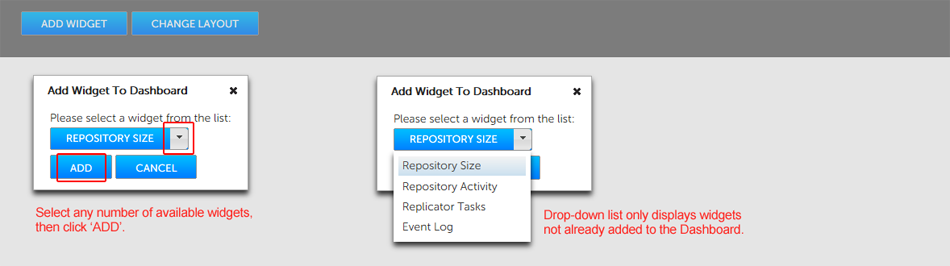
Add a widget to the dashboard.
 Drag-and-drop widget placement
You can can arrange the available widgets any way you like by dragging them around the dashboard while holding the right mousebutton down.
The following widgets are currently available for display on the dashboard:
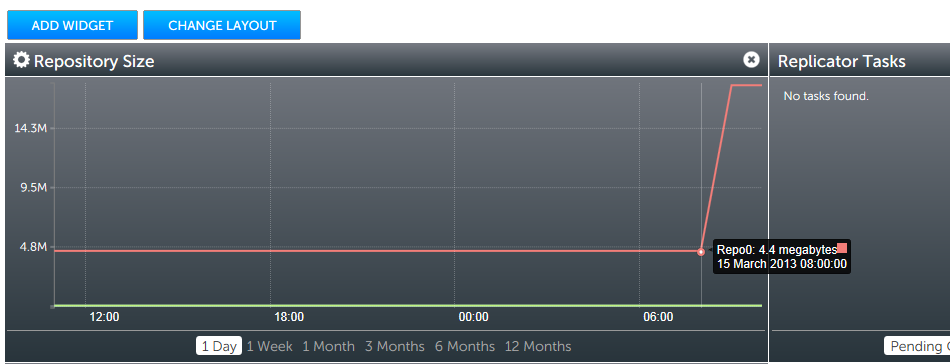
View changes in repository size over time.
The Repository Size widget graphs changes in the size of selected repositories. Click on the cog icon and enter the name of each repository that you want to track.
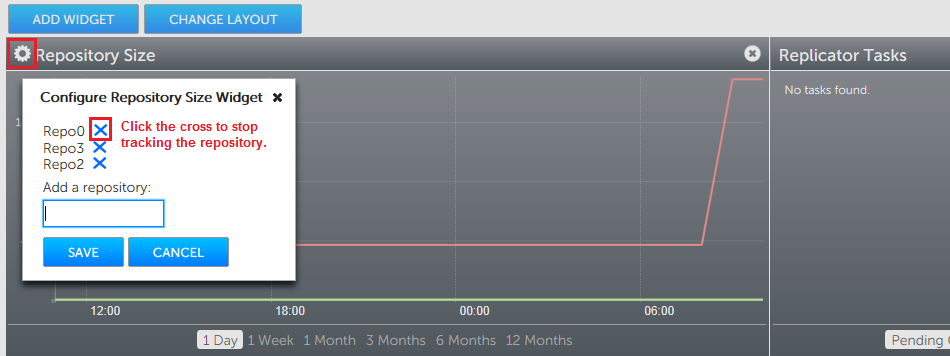
Adding/Removing repositories from the Repository Size widget.
It's possible to add and remove repositories at any time. You can change the time scale of the graph (the available units are available time units; 1 Day, 1 Week, 3, Months, 6 months and 12 months). A detailed log of changes is displayed if you hover your mouse over a repository line.
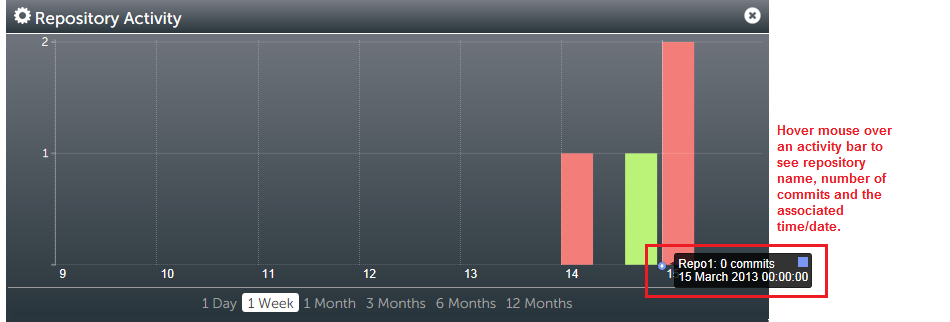
Commits - when and how many.
The Repository Activity widget graphs all changes that are made to selected repositories. All commits that are made to a repository are logged. You can change the time-scale of the graph by clicking on one of the available time units; 1 Day, 1 Week, 3, Months, 6 months and 12 months.
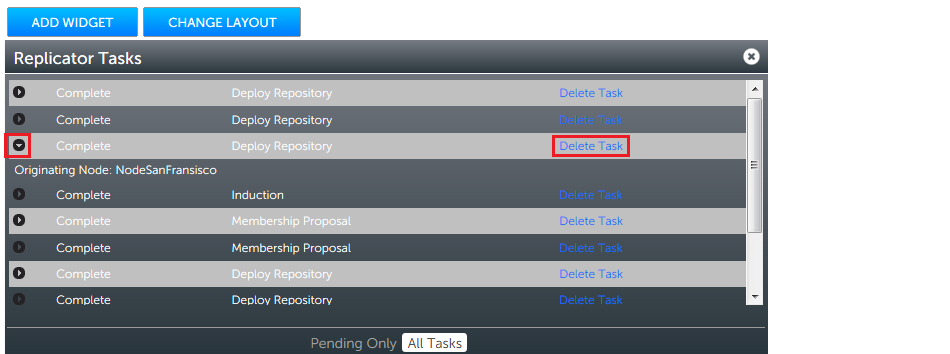
View the tasks that have been replicated between
Lists all actions that have been replicated.
The event log widget list all system events on the node.
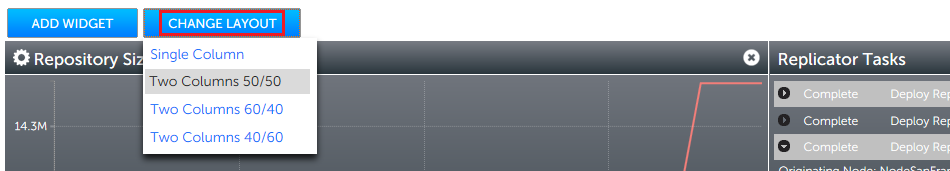
You can make the dashboard single or double column.
Use the Change layout button button to select between four available screen arrangements - Single column or double column (split 50/50, 60/40 or 40/60).
The  button is used to remove the applicable widget from the dashboard. You can clear widgets if you want to declutter.
The  button is used to remove the applicable widget from the dashboard. You can clear widgets if you want to declutter.